Water Quality in the Sound Got Significantly Worse in Early August As Compared to Mid-July
How difficult is it to figure out and then make generalizations about water quality conditions on Long Island Sound at any one time? For me, very. Here’s an example: Three weeks ago I wrote in a post:
Don’t ask why because nobody knows, but water quality in Long Island Sound, as measured by dissolved oxygen concentrations, seems to be better this year than at similar times in the previous four years, and conditions actually improved in mid July when compared to the first 10 days of the month.
I based that assertion on dissolved oxygen data collected and then disseminated by the Connecticut Department of Environmental Protection. Almost immediately afterward we had a spell of really hot weather, which always makes hypoxia – that is, low levels of dissolved oxygen in the water – worse.
Yesterday the DEP sent out its data from early August and they show has fast conditions can change.
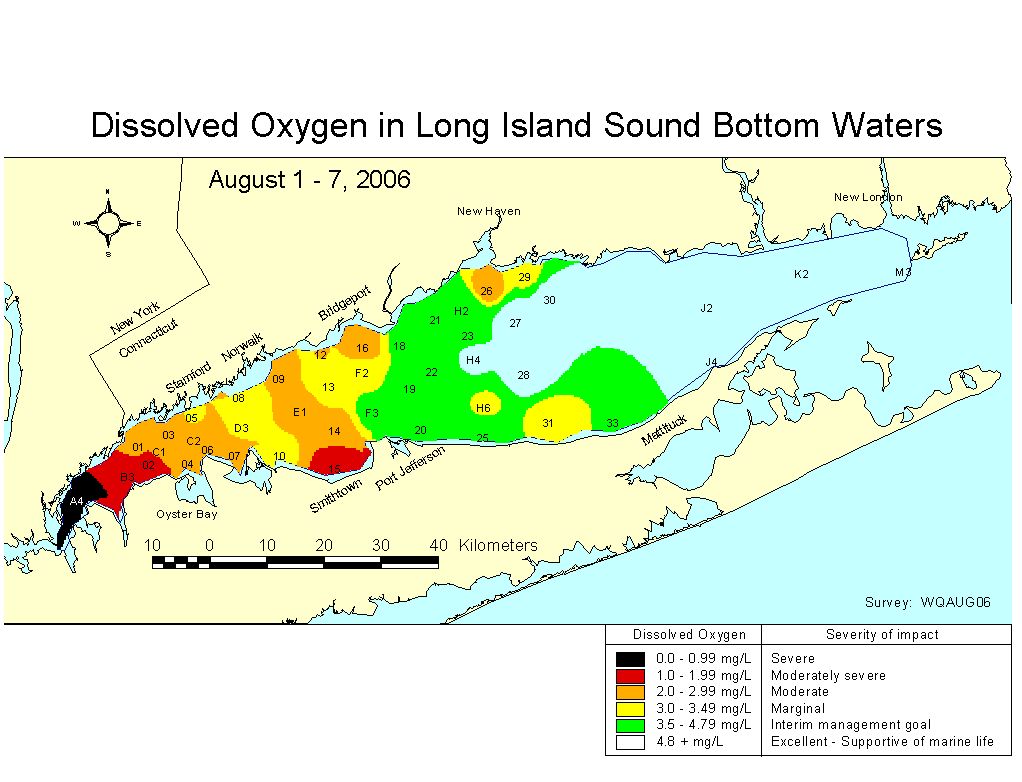
In mid July, 54.4 square miles of the Sound had dissolved oxygen concentrations below 3.5 milligrams per liter, which is the minimum Connecticut water quality standard.
In early August, 346 square miles were below 3.5. That’s more than one quarter of the Sound, by the way.
The DEP report, which was written by Katie O’Brien-Clayton, indicates that things very well could get worse:
Unless conditions change radically, data to date suggest the extent and duration will continue to be above average. [By “above average,” I assume she means worse than usual.]

On the other hand, we’ve had a number of cool and breezy days lately, which are exactly the kind of conditions that can inject oxygen into the Sound and ease hypoxia. Whether those conditions constitute a radical change, time will tell.
The DEP report also includes a chart comparing early August DO levels from 2002 through 2006.
Here’s what it shows, in square miles:
Under 0.9 milligrams per liter: 2002 – 41.7 square miles; 2003 and 2004 – 0 square miles; 2005 – 18.7 square miles; 2006 – 17.5 square miles.
0-1.99 mg/l: 2002 – 61 square miles; 2003 – 13.1 square miles; 2004 – 0 square miles; 2005 – 71.7 square miles; 2006 – 61 square miles.
0-2.99 mg/l: 2002 – 128.7 square miles; 2003 – 106.2 square miles; 2004 – 20.5 square miles; 2005 – 177.4 square miles; 2006 – 198.9 square miles.
0-3.99 mg/l: 2002 – 286.4 square miles; 2003 – 274.5 square miles; 2004 – 283.4 square miles; 2005 – 418.8 square miles; 2006 – 481.3 square miles.
Any trends to be remarked on or conclusions drawn from those numbers? I think I’ll hold off.
Don’t ask why because nobody knows, but water quality in Long Island Sound, as measured by dissolved oxygen concentrations, seems to be better this year than at similar times in the previous four years, and conditions actually improved in mid July when compared to the first 10 days of the month.
I based that assertion on dissolved oxygen data collected and then disseminated by the Connecticut Department of Environmental Protection. Almost immediately afterward we had a spell of really hot weather, which always makes hypoxia – that is, low levels of dissolved oxygen in the water – worse.
Yesterday the DEP sent out its data from early August and they show has fast conditions can change.
In mid July, 54.4 square miles of the Sound had dissolved oxygen concentrations below 3.5 milligrams per liter, which is the minimum Connecticut water quality standard.
In early August, 346 square miles were below 3.5. That’s more than one quarter of the Sound, by the way.
The DEP report, which was written by Katie O’Brien-Clayton, indicates that things very well could get worse:
Unless conditions change radically, data to date suggest the extent and duration will continue to be above average. [By “above average,” I assume she means worse than usual.]
On the other hand, we’ve had a number of cool and breezy days lately, which are exactly the kind of conditions that can inject oxygen into the Sound and ease hypoxia. Whether those conditions constitute a radical change, time will tell.
The DEP report also includes a chart comparing early August DO levels from 2002 through 2006.
Here’s what it shows, in square miles:
Under 0.9 milligrams per liter: 2002 – 41.7 square miles; 2003 and 2004 – 0 square miles; 2005 – 18.7 square miles; 2006 – 17.5 square miles.
0-1.99 mg/l: 2002 – 61 square miles; 2003 – 13.1 square miles; 2004 – 0 square miles; 2005 – 71.7 square miles; 2006 – 61 square miles.
0-2.99 mg/l: 2002 – 128.7 square miles; 2003 – 106.2 square miles; 2004 – 20.5 square miles; 2005 – 177.4 square miles; 2006 – 198.9 square miles.
0-3.99 mg/l: 2002 – 286.4 square miles; 2003 – 274.5 square miles; 2004 – 283.4 square miles; 2005 – 418.8 square miles; 2006 – 481.3 square miles.
Any trends to be remarked on or conclusions drawn from those numbers? I think I’ll hold off.
posted by Tom Andersen at 10:41 AM
![]()
![]()


1 Comments:
I've been thinking about this for a long time ... but can anyone tell me when the summertime waters closer to New York were anything but hypoxic? The same question comes up with the seasonal "dead zones" off the Mississippi, Florida, and Oregon.
The strange part about these four areas, including the western LI Sound, is that there are some mighty powerful currents. If you look at the map, the area after Hell's Gate is in the black zone, the most hypoxic in perhaps the entire US - yet I know the current can flow much faster than 5 knots depending on the tide.
I've sailed the Hell's Gate to Block Island, the Mississippi outfall, and the coast off Sarasota Florida - all had currents of over 7 knots at certain times. It seemed like the stronger the current, the worse the pollution. To me this just doesn't add up right, and requires some further explanation. Thanks.
Post a Comment
<< Home